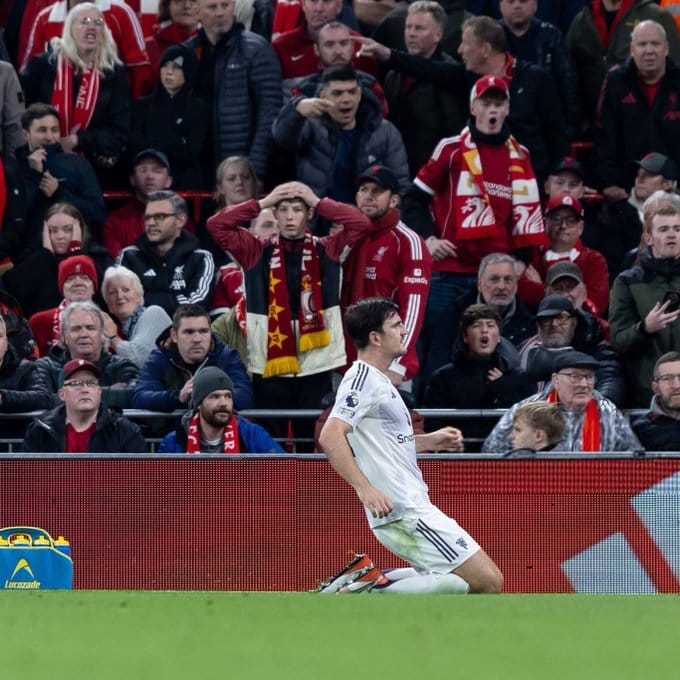
United went to Liverpool and did exactly what a team in transition needs to do: we controlled what we could control, stayed composed under pressure, and struck when it mattered. The statistics tell a story of tactical intelligence and growing confidence under Amorim.
Table of Contents
The Numbers That Define This Win
Where It Mattered Most
The headline stat was predictable. Liverpool 64% possession, United 36%. But dig deeper and the real story emerges. Despite that 28-point possession gap, both sides reached the final third exactly 63 times. United weren’t outclassed territorially, they were efficient.
The big-chance ledger was 5–5. Liverpool had 19 shots to United’s 12, yet both created equal-quality opportunities. xG: United 1.34, Liverpool 2.75. On paper they could have scored more… but they didn’t. That gap between model and outcome is where Amorim’s structure shows its value.
Directness as a Tactical Weapon
United’s approach was vertical and purposeful. Long-ball accuracy of 57% (Liverpool 24%) created consistent break opportunities.
Mbeumo thrived in these spaces, and the early goal set the tone. Final-third passing tells the deeper story: United 56% in Liverpool’s third vs Liverpool 81% in ours. The difference? United were clinical when they had it.

39 touches, 22 in the final third. Mbeumo's heat map shows the constant threat on the break. clinical finishing and intelligent positioning.
The Cross Battle Was Won By Shape
Liverpool attempted 48 crosses to United’s 12.
Completion: Liverpool 19%, United 33%. That’s structure, not luck. The six-yard line stayed protected. Maguire’s team-leading 8 clearances and de Ligt’s 5 underline discipline rather than panic.
Goalkeeping Decides Tight Margins
Senne Lammens recorded 5 saves and posted +1.33 goals prevented.
Liverpool’s keeper ended at –0.94. With an xG gap of about 1.4, goalkeeper performance was a real swing factor and Lammens once again supplied the platform.
Duels and Workload: Structure Over Exhaustion
United won 47% of duels overall (46% aerial specifically), which directly correlates with the 46 clearances made. This could look like panic defending, but the data suggests otherwise. The clearance volume reflects Liverpool's relentless approach, but the duel win percentage shows United competed in every phase. Defensively, the team was engaged and organized, not overwhelmed.
Corners conceded (9) were high, but United's box structure held firm. No soft goals, no defensive breakdowns. Just relentless pressure met with resilience.
Player Impact Stats
Senne Lammens : 5 saves, +1.33 goals prevented. The platform for everything.
Harry Maguire: 8 clearances (led team), 84th-minute winner. Commanded the defensive phase and delivered in the final moment.
Matthijs de Ligt: 5 clearances. Right-sided security through Liverpool's crossing storm.
Bryan Mbeumo: 62-second goal set the psychological tone. Constant outlet on the break with 57% long-ball accuracy supporting his runs.
What the Stats Reveal About Amorim's System
In a match where traditional metrics favored Liverpool, United's actual performance data, big chances parity, final-third passing efficiency differential, duel competitiveness, and goalkeeper excellence. Paints a picture of a team executing a clear plan.
The 63 final-third entries for each side is the key: possession doesn't directly drive attacking threat, structure and clinical finishing do. United's 1.34 xG on fewer shots shows shot selection and positioning, not luck. Our 56% final-third passing accuracy, while lower than Liverpool's 81%, came with purpose, we weren't trying to dominate the midfield; we were breaking quickly and creating chances.
This is a system beginning to function under the highest pressure.
The Verdict
United went to Anfield and did the job. The statistics support what the result confirms: we competed where it mattered, defended with discipline, and finished when it counted. The team's tactical compactness aren't small margins, they're the foundation Amorim is building.
Three points at Anfield and the data says they earned them.
Match Stats at a Glance
Metric | United | Liverpool |
|---|---|---|
xG | 1.34 | 2.75 |
xG Share | 32.8% | — |
Big Chances | 5 | 5 |
Shots (Total / On Target) | 12/4 | 19/6 |
Shot Accuracy | 33.3% | 31.6% |
Shots in Box | 10 | 16 |
Final-third Entries | 63 | 63 |
Corners | 4 | 9 |
Possession | 36% | 64% |
Touches in Opposition Box | 16 | 52 |
Crosses (Accuracy) | 4/12 (33%) | 9/48 (19%) |
Long Balls (Accuracy) | 27/47 (57%) | 18/75 (24%) |
Final-third Passing Accuracy | 58/104 (56%) | 123/152 (81%) |
Duels Won | 47% | — |
Aerial Duels Won | 46% | — |
Clearances | 46 | — |
Goalkeeper Goals Prevented | +1.33 | –0.94 |

